Your AI agents don't have a budget. Give them one.
Track per-developer costs, get alerts before spend surprises you, and see how AI tools affect delivery. Acticly is free for engineering teams.
Built for engineering leaders who need to control AI spend and see how the team actually delivers, before either becomes a surprise.
A real, fully-populated workspace — read-only, no signup. See the products
Unusual activity
$4,281
Claude Code agent spike.
Core platform
Daily cap$1,850 / $2,000
Why Acticly
Dashboards show usage.
They don't show who to fix. Acticly does.
Per-developer AI spend, token vs subscription fit, and alerts before finance gets involved — without another dashboard to babysit.
Tue · 02:14 AM
An agent hit an infinite loop trying to fix its own syntax error. Nobody saw the alert until 7 AM.
With Acticly: threshold alerts fire when burn crosses a daily cap — per developer, per tool.
Claude Code burn hit $4.7k overnight for @alex — over daily cap. Review in Acticly?
One junior dev. 31 days.
On Claude alone, before anyone noticed.
With Acticly: see session-level cost in real time, not month-end.
Five tools. Zero owners.
No central visibility. Procurement found out from the Stripe statement.
With Acticly: one view across Claude Code, Cursor, and Codex — enroll devs, set caps, compare seat vs burn.
Three patterns. One control layer.
Acticly gives engineering leaders per-person visibility and early alerts across the agents your team already runs.
Two products, one platform
Start with either, or both.
Acticly gives engineering teams visibility into their AI tools and their delivery performance.
AI Insights
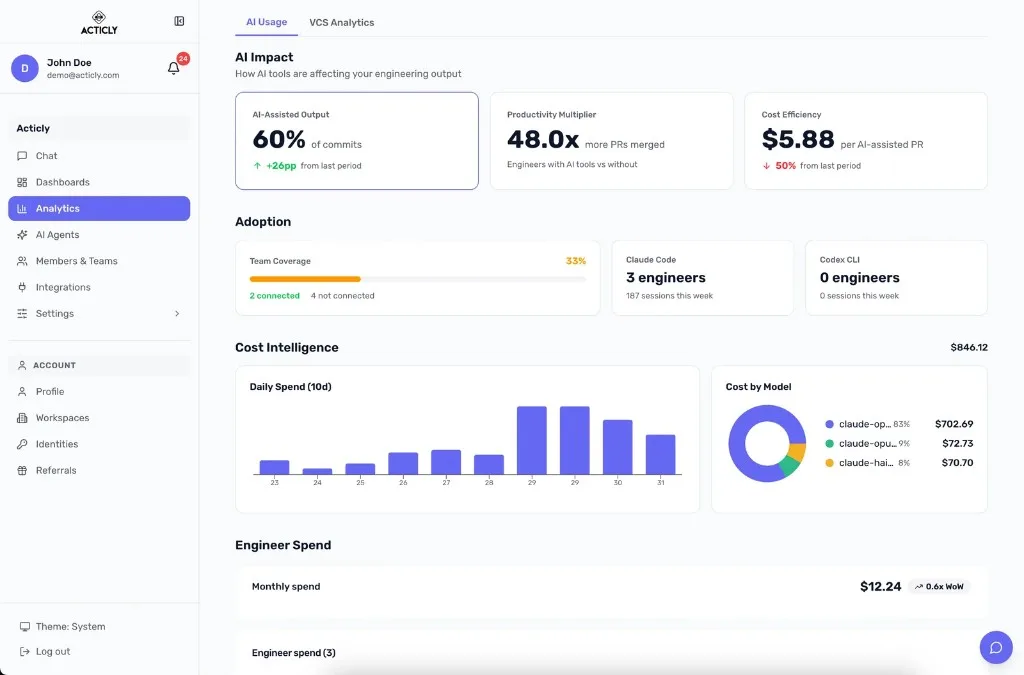
Connect your AI coding tools and understand the real cost, usage, and value across every developer.
Free
Included for all team sizes today
What's included
- Connect AI tools: Claude Code, Codex and more.
- Spend visibility: Per developer, team, and project.
- Alerts: Usage spike and threshold notifications.
- AI value measurement: Code accepted, time saved, velocity impact.
Team Insights
Connect Jira and GitHub to understand how your team works, delivers, and stays healthy.
Free
Included for all team sizes today
What's included
- VCS analytics: Commits, PRs, code reviews, work patterns.
- Custom dashboards: 9 templates, or build your own with AI.
- DORA metrics: Lead time, deploy frequency, MTTR, failure rate.
- Work-life balance & wellbeing: Off-hours work, weekend activity, peak hours.
- AI chat for your metrics: Ask anything about team performance and delivery.
Agent-first access
Use Acticly from the agent you already have
Connect Acticly's MCP server to Cursor, Claude Code, ChatGPT, or any MCP client. Use the model you want — no need to open the Acticly UI to get a full picture.
Connect once
Add the server URL to your agent and sign in. No API key to generate, paste, or rotate.
Ask anything
Team metrics, AI adoption, alerts, and natural-language queries — the same intelligence as chat, without opening the UI.
Daily & Weekly Pulse
One-page narratives across delivery, AI spend, wellbeing, and risks. Run when you want a proper overview of how your company is doing.
Claude, Claude Code, Codex, Cursor, and VS Code — one command or one pasted URL, then sign in.
AI cost control
Three ways AI spend goes sideways
The math
One session. One developer. One month.
$25 for one 90-minute session. Multiply by ten devs across twenty working days and you’re at $5,000 a month - and that’s a small team. Your AI coding agents have no spending visibility unless you add it. Acticly gives you spend visibility and alerts for your favorite AI tools such as Claude Code and Codex in minutes.
No auto-play. Use arrows, dots, or keyboard (← →) when the story card is focused.
Control and clarity, from day one
Real-time visibility, early alerts, and fast setup across the AI tools your team already uses.
See spend in real time
Per-user, per-session, per-day. Know who is using what and how much it costs. Not at the end of the month, right now.
Session-level burn updates continuously
Match the plan to the person
Engineering managers see token vs seat pricing side by side for every developer. Each person gets a clear signal when they are on the wrong billing model — before shadow cost shows up in finance.
Shadow cost · same team, wrong models
- Dedicated developer → flat subscription when burn is steady
- Light use → metered tokens
- Engineering manager → pick per person, not one plan for all
Recommendation per developer
Connect in 2 minutes
Works with your favorite AI tools such as Claude Code and Codex. No code changes. Your team gets clear status when they're connected.
Signal becomes story. Story becomes action.
Most engineering dashboards show you snapshots. That's why managers stop opening them. A number on its own — 12 active contributors, 18% off-hours, 47 PRs merged — doesn't tell you whether anything needs to change. So you do the interpretation in your head, get tired, and close the tab.
Acticly is built on a different principle: every signal should pair with a story, and every story should end in an action.
Example
We don't just surface that cycle time crept up — we name the three PRs stuck in review, point to where review load has concentrated on one person, and walk you to the redistribution.
You look. You act. That's the loop.
Spend visibility is just the beginning
Acticly is also an engineering platform, so you can see whether that AI spend is actually moving the needle. Connect GitHub and Jira and we'll correlate your spend directly with engineering outcomes.
PR velocity, cycle time, deployment frequency. Find out if those expensive AI tools are actually making your team faster.
Dashboards, ready in seconds
Pick a template, build your own, or let AI generate one.
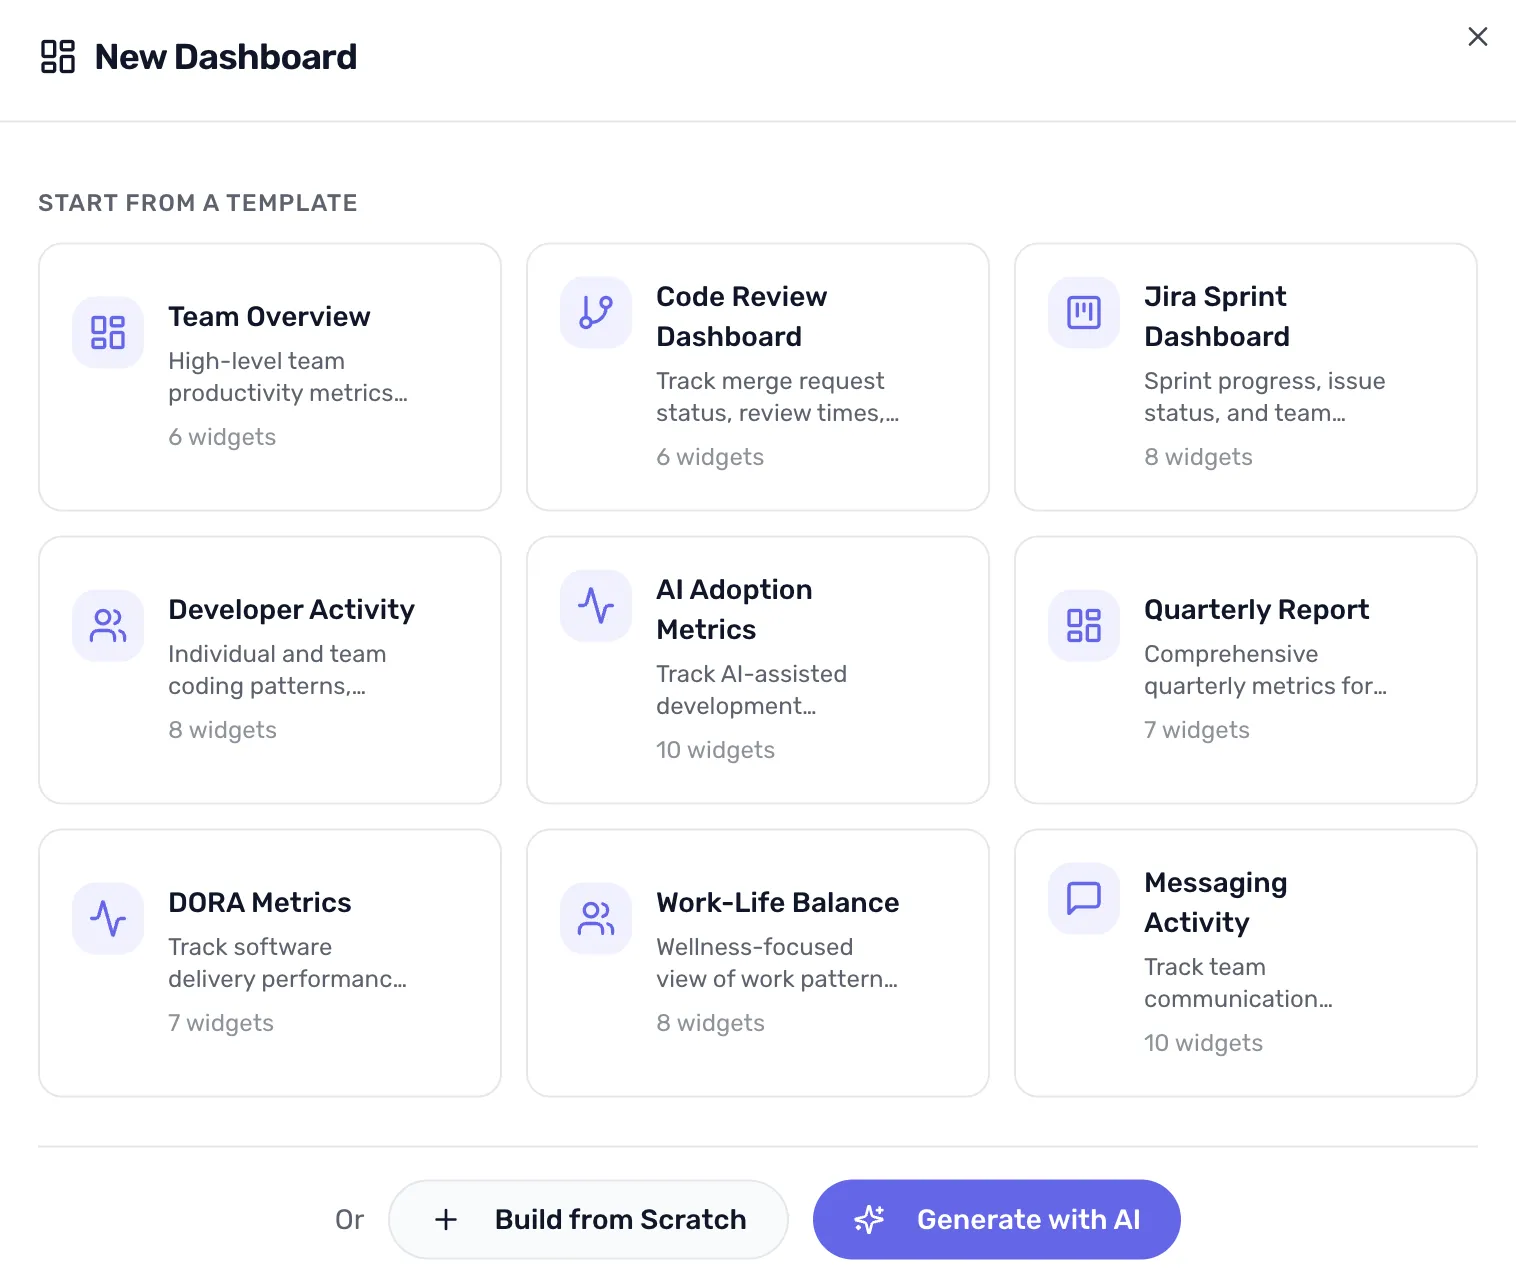
From DORA metrics to AI adoption, every team gets the view that fits how they ship.
Measure true ROI of AI investments
Correlate spend with PR velocity, cycle time, and recovery, so budget conversations start with outcomes.
Spot teams that need AI enablement
See who is stuck versus who is shipping. Intervene with coaching or guardrails, not guesswork.
Catch delivery risks before they bite
Anomaly detection on deployment frequency, review wait time, and incident patterns — so you hear about problems while they’re still small.
Protect team wellbeing
Surface off-hours commits, weekend work, and burnout signals before they turn into resignations.
Works in your agent via MCP
Connect from Cursor, Claude Code, or ChatGPT — query metrics, run Daily Pulse, or get a Weekly Pulse without opening the UI.
Every chart explains itself
Widgets follow the signal → story → action loop — what changed, why it matters, and what to do next.
Justify software budgets to the board
Exportable, plain-language narratives that tie tooling cost to delivery impact.
Every chart, every widget — explained in plain language
This is the loop in practice — plain-language answers that end in a suggested next step.
AI spend, deployment frequency, PR health, team wellbeing — one click on any widget and Acticly tells you what changed, why it matters, and what to watch next. No jargon, no analyst required.
Or just ask Acticly anything about your team metrics.
Chat
AI assistant for your team metrics
Is our AI spend actually making us faster?
Yes. Your team's PR cycle time improved 11% while AI adoption grew to 48%.
That's $4,200 in AI spend generating an estimated 15% productivity gain across the backend team.
Developers using AI tools are closing bugs 32% faster. MTTR improved from 27 min to 18 min.
Board-ready insight
“We invested $4,200 in AI tools this month and saw a 32% improvement in our defect resolution speed.”
Ask about team metrics, productivity, or code reviews…
Team Insights
The questions behind every standup, and every AI rollout
If these sound familiar, you need signal from Jira, GitHub, and your team, not another static dashboard.
Delivery & team health
- “Who's actually overloaded right now?”
- “Are we shipping fast... or just shipping?”
- “Who's reviewing all these PRs?”
- “Every standup: 'no blockers.' Every quarter: a resignation.”
- “The dashboards say we're fine...”
- “When did she last take a day off?”
AI & impact
- “Is our AI tooling even worth the spend?”
- “How much time has AI actually saved us?”
- “Copilot costs $19/seat... is it worth it?”
- “Is AI improving quality or just volume?”
- “We shipped more but broke more too.”
Sound familiar?
You deserve answers,
not more dashboards.
Ask in plain language. Get the truth about productivity, delivery, and team health, with Team Insights (and AI Insights when you connect coding tools).
Measure the team,
not the individual.
Velocity dashboards stop being useful the moment they start grading people. We implement SPACE the way its authors intended — aggregated, and team-level by default.
Every signal comes from GitHub and Jira. Nothing new to install, no surveys to nag the team about.
What we won't build — the full list, including the one place a name does appear.
- SSatisfaction
Off-hours commits, weekend PRs, and creeping review latency — the early signals of a team running hot, long before anyone files a ticket about it.
- PPerformance
Outcomes tied to Jira epics and releases. What shipped, not who typed the most.
- AActivity
PRs, reviews, and deploys — aggregated at the team level. No delivery leaderboards.
- CCommunication
Review turnaround and hand-off latency across GitHub and Jira. Finds the bottleneck, not the person.
- EEfficiency
Flow interruptions: context switches, blocked PRs, WIP sprawl.
Integrates with your entire stack
GitHub, Jira, Bitbucket, and Slack for delivery and team signals. Claude Code, Codex, and any tool behind a LiteLLM gateway for AI spend — one platform, no new surveys.
Delivery and collaboration
AI spend
AI adoption
Need a different integration?
We support custom data sources and on-premise tools.Our team can help wire Acticly into your environment.
Request an integrationPricing
Acticly is free
In the future, we may introduce paid features or plans. If we do, we'll clearly describe the terms and pricing before you're charged.
Your AI agents don't have a budget. They should.
Start tracking AI spend and delivery signals in minutes. Layer on Team Insights when you're ready for full visibility.